
 This week, I’m rerunning some popular posts while I prepare for this Friday’s live video webinar: Specialty Drugs Update: Trends, Controversies, and Outlook .
Click here to see the original post from May 2022.
When rebates and discounts were factored in, brand-name drug prices declined—or grew slowly—in 2021. Consistent with our previous analyses, rebates and discounts reduced the selling prices of brand-name drugs to less than half of their list prices.
What’s more, average net drug prices have declined for the past five years—though a few companies had net price gains or slower declines in 2021.
As I have pointed out many times, pharma industry perma-critics refuse to accept that brand-name drug prices are falling—or that prescription drug spending is a small and stable portion of overall U.S. healthcare expenditures. That’s why I refer to them as drug pricing flat earthers (#DPFE).
As famous economist John Maynard Keynes reportedly said: “When the facts change, I change my mind.” What will the DPFEs do?
READ ME
If it’s your first time visiting Drug Channels, I suggest you review the following two articles:
- Tales of the Unsurprised: Brand-Name Drug Prices Fell for the Fourth Consecutive Year. This article includes frequently asked questions about gross and net drug prices, the gross-to-net bubble, and SpongeBob SquarePants.
- Warped Incentives Update: The Gross-to-Net Bubble Exceeded $200 Billion in 2021. This article reviews SSR Health’s product-level data on list and net prices.
You can also click here to read all Drug Channels’ articles on the gross-to-net bubble.
BUBBLETASTIC DATA
The following 10 companies publicly reported the 2021 list and net price changes for their U.S. product portfolios. Most also reported average discounts from list price. As always, I encourage you to review the original source material for yourself. Here are links to the relevant reports:
- Genentech: The Science of Pricing (Note: The pricing figures are not visible in Genentech’s chart. Genentech privately confirmed the 2021 figures to me. I interpolated the historical figures from the published chart.)
- Novartis in Society 2021 US Report, page 26
- Novo Nordisk: Annual Report 2021, page 16
If I have missed reports from other companies, please email me.
OUR BUBBLE BUDDY
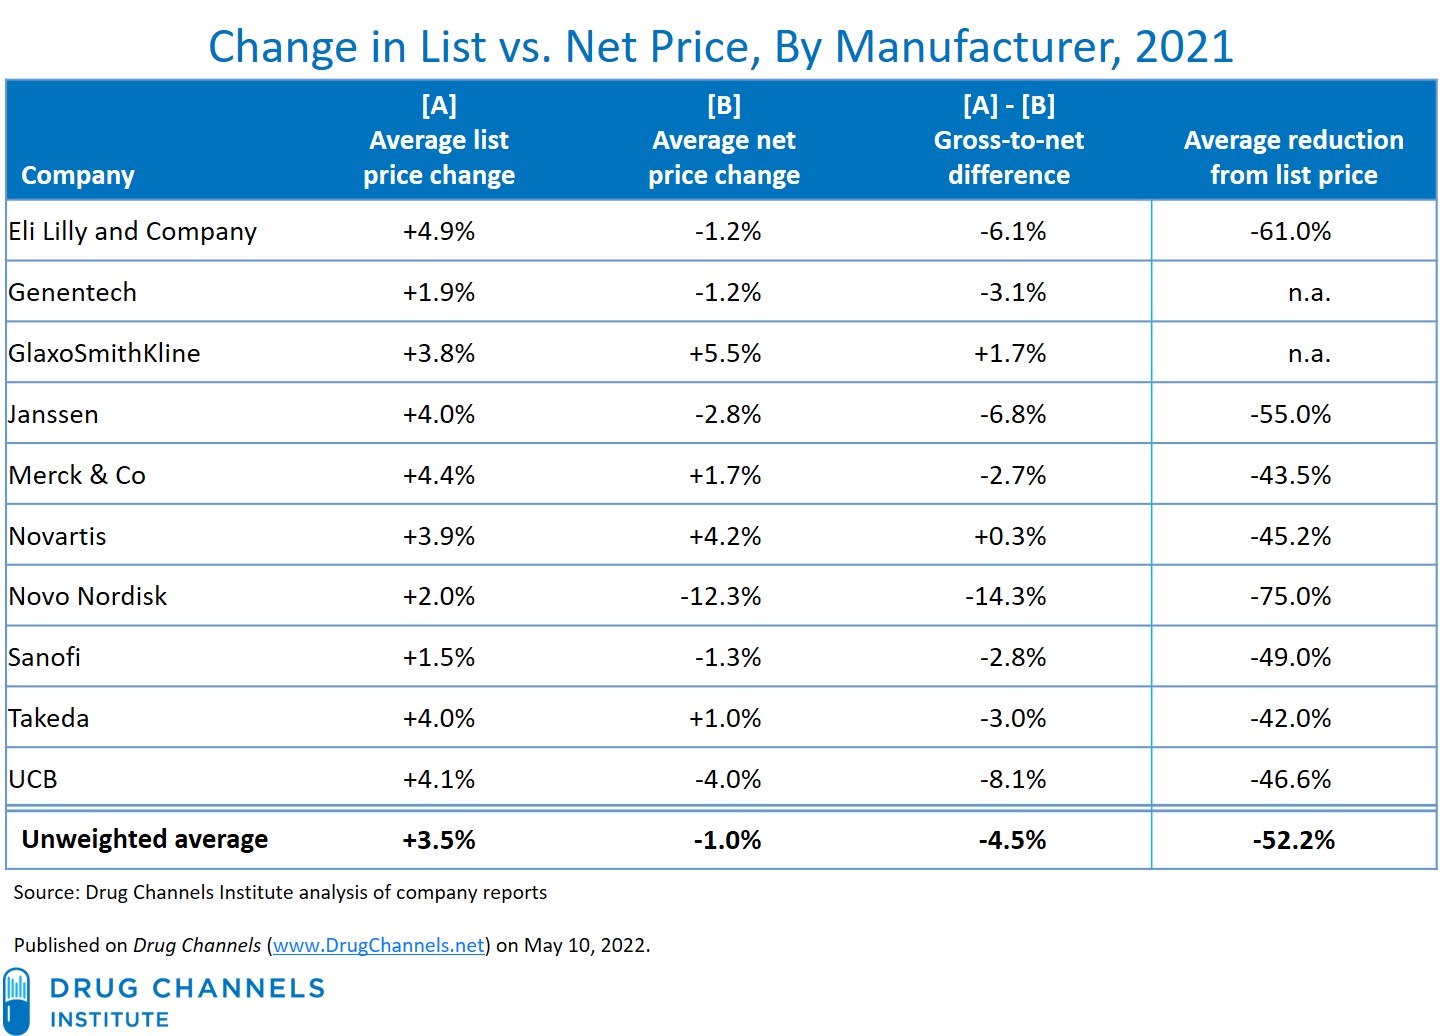
The gross-to-net gaps mean that brand-name manufacturers earn far less revenue than list prices suggest. The table below summarizes the 2021 list and net price changes for the brand-name product portfolios of the 10 large manufacturers along with average discounts.
[Click to Enlarge]
Consistent with our previous analyses, these data show significant gaps between list and net price changes:
- List prices for brand-name drug prices grew slowly. For 2021, brand-name drug list prices grew by less than 5% at all 10 companies. The unweighted average increase was 3.5%.
- Drugmakers sold their products for less than half of the list price. The unweighted average discount off list was 52%, i.e., less than half price. The weighted average brand-name portfolio had list-price discounts of -42% to -75%.
- On average, net prices declined, though some manufacturers saw moderate net price growth. The unweighted change in net prices was -1% in 2021. Net prices declined at six of the 10 manufacturers, but rose at four manufacturers—GlaxoSmithKline, Merck, Novartis, and Takeda.
The gross-to-net difference was positive at two companies, leading to the unusual mix of net prices growing more quickly than list prices. At Novartis, for example, the average reduction from list price declined slightly, from -46.8% in 2020 to -45.2%.
- The unweighted average gross-to-net gap in prices was -4.5%. For 2021, list prices grew by 3.5%, but net prices declined by -1%. Gross-to-net differences ranged from -14.3% to +1.7%.
Some also contain additional details on particular products. For instance, Lilly’s report shows that from 2016 to 2021, the list price of its Humalog insulin grew by 12%, while its net prices declined by 27%. Consequently, each vial had a net price of $43, but generated $232 in rebates and discounts.
BUBBLICIOUS
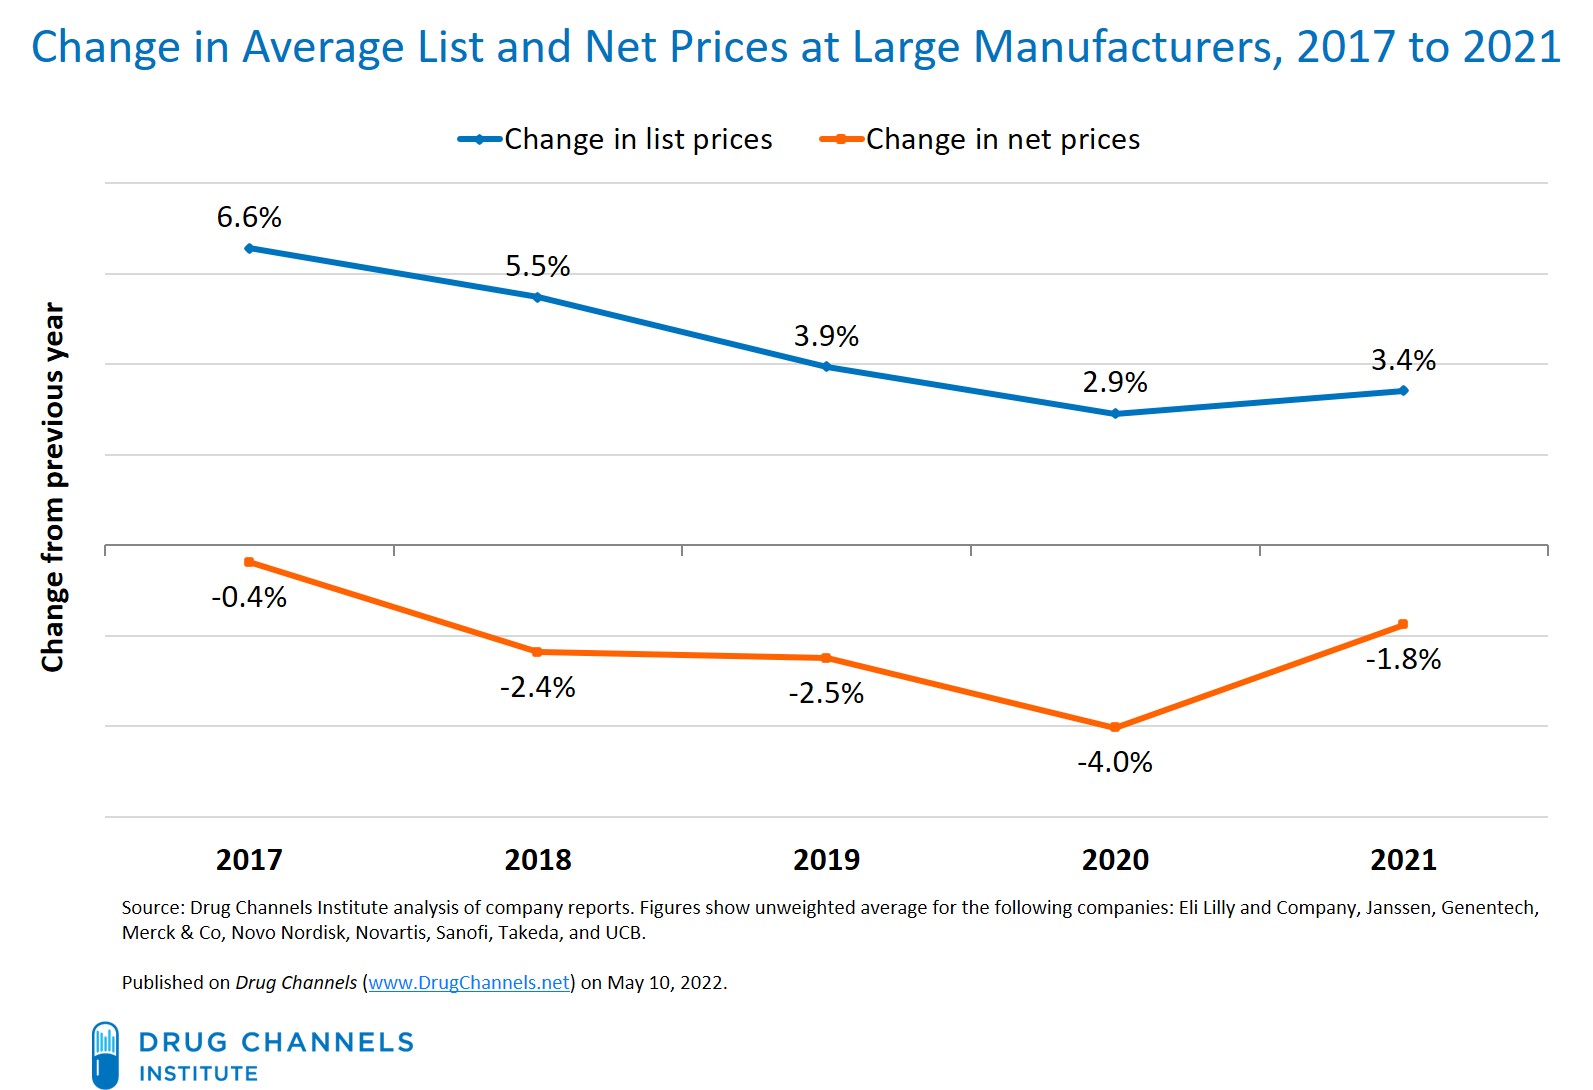
The chart below summarizes price changes from 2017 through 2021, for the nine companies that consistently provided these data over the past five years.
[Click to Enlarge]
Observations:
- List-price growth has remained moderate. The unweighted average list price fell, from 6.6% in 2017 to 2.9% in 2020. It increased slightly, to 3.4% in 2021. These manufacturer-specific disclosures are consistent with the overall industry trends shown in Tales of the Unsurprised: Brand-Name Drug Prices Fell for the Fourth Consecutive Year. (The industry data are based on approximately 100 currently or previously publicly traded firms.)
- Average net prices at the large drugmakers have declined for the past five years. The time series data clearly contradict the overheated and misleading rhetoric from DPFEs.
- Average discounts from list prices have been deepening. Janssen’s average discount rate went from -42% in 2017 to -55% in 2021, while Lilly’s rate went from -51% to -61%. The change was smaller at the four other companies that reported these figures.
- The gross-to-net bubble keeps inflating. We estimate that in 2021, the total value of gross-to-net reductions for patent-protected brand-name drugs was $204 billion, up by $49 billion (+32%) compared with the 2017 figure. The list and net prices changes shown above sustain ever-increasing rebate dollars.
I outlined eight of the factors driving gross-to-net pricing trends in my earlier article.
The manufacturers’ data again reaffirm that any analysis of list prices is a misleading and inaccurate measure of drug pricing. Alas, the facts haven’t stopped journalists, advocacy organizations, and politicians from promoting the false narrative of “skyrocketing” drug prices. For example, Charles Ornstein from Politico and Mark Miller from Arnold Ventures both recently misrepresented the results of a MedPAC study about brand-name prices in Medicare Part D. (I explained their errors in this Twitter thread.)
The gross-to-net bubble’s significant impact on patients—especially when patients are exposed to the undiscounted list price of their prescriptions—continues to grow. Legislation should shield patients from the excesses of the industry’s pricing bubble while enhancing the competitive pressures that continue to reduce drug prices.
Let’s hope that drug pricing flat earthers will begin to accept the realities of drug pricing today and embrace evidence-based policy.
No comments:
Post a Comment