
Brand-name drug prices continue to decline, while the prices of other healthcare products and services continue to rise. For 2021, brand-name drugs’ net prices dropped for the fourth consecutive year. Meanwhile, brand-name drug list prices grew more slowly than overall inflation. What’s more, we project that the gross-to-net bubble for patent-protected brand-name drugs will exceed $200 billion in 2021. See our updated analysis below.
The factors that drive declining brand-name drug prices remain for 2022, suggesting that these trends will continue.
Pharmaceuticals account for less than 15% of U.S. healthcare spending—but absorb 99% of the political heat and attention. Let’s hope that this peek through the truth binoculars intrudes on any future legislative attempts to address drug pricing and the reimbursement system.
DATA DISAMBIGUATION
To examine drug pricing, we rely on data from SSR Health, an independent organization that collects and reports data on pharmaceutical prices. SSR Health is widely regarded as the leading provider of these data. In a testament to SSR Health’s influence, the Institute for Clinical and Economic Review (ICER) relies on these net price data in its cost-effectiveness evaluations. Click here to learn more about SSR Health and its US Brand Rx Net Pricing Tool webpage.
SSR Health’s list and estimated net pricing figures are based on approximately 1,000 brand-name drugs with disclosed U.S. product-level sales from approximately 100 currently or previously publicly traded firms. The products and companies in the SSR Health numbers account for more than 90% of U.S. branded prescription net sales. SSR Health updates these figures quarterly, and its historical figures date from the first quarter of 2007. During 2021, SSR was able to expand the number of products with gross-to-net estimates, so the historical data shown below differs slightly from SSR’s previous figures.
Here’s DCI's quick refresher on drug pricing terminology:
- The manufacturer of a drug establishes the drug’s list (gross) price, called the Wholesale Acquisition Cost (WAC). A manufacturer’s gross revenues equal its revenues from sales at a drug’s WAC list price.
- A drug’s net price equals the actual revenues that a manufacturer earns from a drug after rebates, discounts, and other reductions. A drug’s net revenues equal its revenues from sales at the drug’s net price.
- Rebates to commercial payers, Medicare Part D plans, the Medicaid program, and other payers
- Discounts to healthcare providers under the 340B Drug Pricing Program
- Manufacturers’ payments to drug channel participants (admin fees to PBMs; fees and discounts to drug channel participants; and fees and discounts to pharmacies)
- Patient assistance and copayment support funds
DRUG PRICING REALITIES
The chart below summarizes the list and net price changes for a broad set of brand-name drugs over the past eight years:
[Click to Enlarge]
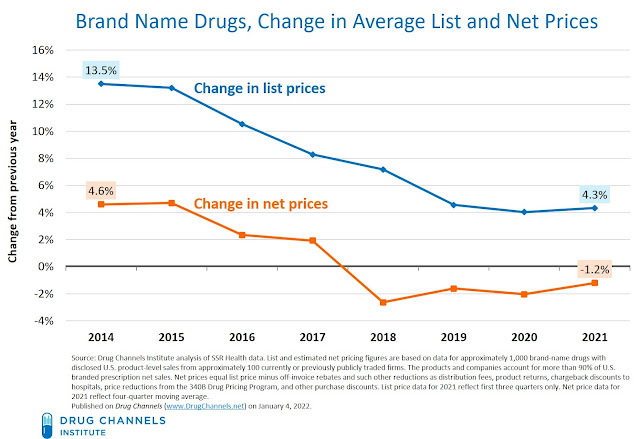
Consistent with our previous analyses, these data show significant gaps between list and net price changes:
- List-price growth remains in the mid-single digits. From 2010 to 2015, growth in list prices was increasing by 10% to 15%. Growth has slowed sharply, from 13.5% in 2014 to 4.3% through the first three quarters of 2021. According to 46Brooklyn, (unweighted) list price growth in 2022 remains in the mid-single digits.
- Net prices for brand-name drug prices dropped for the fourth year. Through the first three quarters of 2021, net prices declined by -1.2%. The gross-to-net gap in prices was therefore -5.5% (= -1.2 minus 4.3).
These industry data are consistent with the manufacturer-specific disclosures about changes in list and net drug prices that I discuss in Gross-to-Net Bubble Update: Net Prices Drop (Again) at Six Top Drugmakers. For 2020, list prices at those six manufacturers grew by 2.9%, while net prices declined by -3.1%. The unweighted average gross-to-net gap in prices was -6.0%. (Note that SSR’s figures are sales-weighted, while the manufacturer-specific figures reflect the unweighted average.)
- List and net prices grew more slowly than overall inflation. The consumer price index rose by nearly 5% during the first three quarters of 2021—the time period shown in the chart above. (It has since increased further.) This means that real, inflation-adjusted list prices dropped, while real net prices declined even further.
- The gross-to-net bubble keeps inflating. Drug Channels Institute coined the term gross-to-net bubble to describe the dollar gap between gross sales at brand-name drug list prices and their sales at net prices after rebates and other reductions. We use “bubble” to characterize the speed and size of growth in the total dollar value of manufacturers’ gross-to-net reductions.
Through the compounding effect of gross-to-net pricing differences, the total value of manufacturers’ off-invoice discounts, rebates, and other price concessions for patent-protected brand-name drugs continues to expand. DCI projects that for 2021, the total value of gross-to-net reductions for patent-protected brand-name drugs exceeded $200 billion. (See Exhibit 167 of our 2021 pharmacy/PBM report for context.)
As I noted during the Drug Channels Outlook 2022 webinar, net price trends are likely to remain negative in 2022. The factors behind ongoing gross-to-net differences include (but are not limited to):
- A highly concentrated PBM industry
- Aggregation of PBM rebate negotiations via recently formed group purchasing organizations
- Competition from biosimilars (particularly for provider-administered drugs)
- Crowded, highly competitive therapeutic categories
- Payers’ ongoing adoption of copay accumulator adjustment and copay maximizers
- Expanding formulary exclusion lists
- Skyrocketing growth in 340B Drug Pricing Program discounts
- Mandatory rebates and discounts to government payers
I have long expected that some type of targeted repricing would pop the gross-to-net bubble for certain products. So far, plans and PBMs seem reluctant to accept products with lower list prices. Consider the sad tale of Semglee: Why PBMs and Payers Are Embracing Insulin Biosimilars with Higher Prices—And What That Means for Humira.
Drug spending accounts for a small—and shrinking—share of the $4.1 trillion in total U.S. healthcare spending. The growth rates shown above, combined with the coming wave of generic drugs and biosimilars, mean that tackling healthcare costs will require a lot more than attacking pharmaceuticals.
Can someone please pass the news along to the politicians, journalists, and physicians who distort the truth about drug prices?
No comments:
Post a Comment