

Today, I examine the key insights from these latest figures.
As you will see, outpatient drug spending remains a small—and shrinking—share of the $4.1 trillion spent on U.S. healthcare. What's more, drug spending again grew more slowly than overall healthcare spending.
Meanwhile, consumers shoulder a much higher portion of this spending compared with their share of hospital spending.
Demonizing pharmaceuticals as a driver of U.S. healthcare spending growth is simply inaccurate. Sadly, our politicians and journalists will probably continue to ignore the facts in favor of their opinions.
I ♥ DATA
As always, I encourage you to review the CMS source materials:
- Health Affairs article: National Health Care Spending In 2020: Growth Driven By Federal Spending In Response To The COVID-19 Pandemic (The article is free for subscribers; others may purchase it.)
- National Health Expenditures data files (Free for all to enjoy!)
BIG DOLLARS
As measured in the National Health Expenditures (NHE) accounts, total U.S. spending on healthcare was an astonishing $4,124,005,000,000 ($4.1 trillion) in 2020, up 9.7% from the 2019 figure. The chart below summarizes the major spending categories.
[Click to Enlarge]
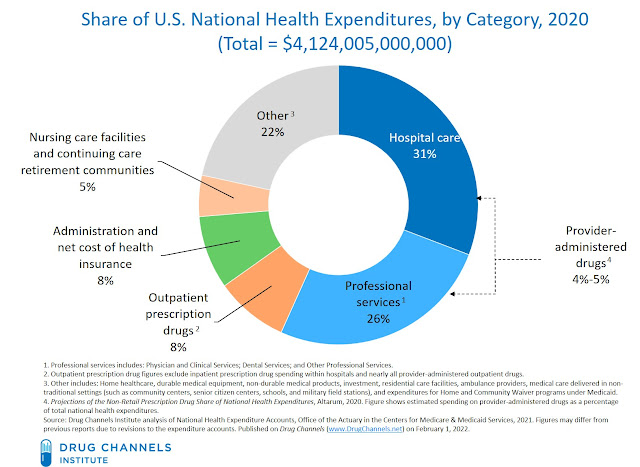
In keeping with previous years’ figures, spending on hospital care and professional healthcare services was more than six times higher than spending on outpatient prescription drugs:
- More than $2.4 trillion (57%) in total 2020 healthcare expenditures came from hospital care and professional services (physicians, dentists, and other healthcare professionals). These categories’ shares have been consistent for many years.
- In 2020, U.S. net spending on outpatient prescription drugs was $348.4 billion. As I explain below, this spending figure is roughly comparable to net, post-rebate spending on patient-administered drugs paid under the pharmacy benefit.
- For 2020, outpatient prescription drugs accounted for only 8.4% of U.S. healthcare spending, having fallen from a 9.9% share in 2015. By comparison, administrative costs—the net cost of health insurance and government administration—accounted for a greater share (8.5%) of national expenditures.
We can also understand the relative size of the three major spending categories by examining year-over-year growth in spending. From 2019 to 2020:
- The U.S. spent $76.4 billion (+6.4%) more on hospital services and $46.9 billion (+4.6%) more on professional services.
- Spending on outpatient prescription drugs grew by only $10.2 billion (+3.0%).
OUT-OF-POCKET MADNESS
Let’s face it. Few American patients care about wonky policy terms such as “health expenditures” and “net drug price.” (Sadly, most don’t even read Drug Channels.)
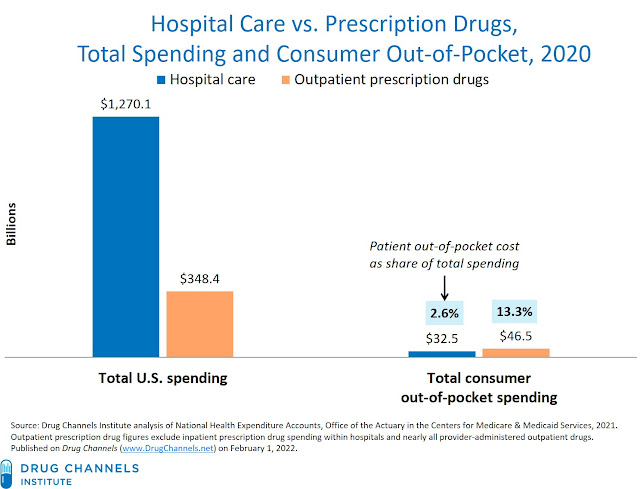
But patients do care about their out-of-pocket spending. An unusual aspect of U.S. healthcare is the relative share of costs that patients bear for different services. For 2020:
- Total U.S. spending on hospital care was more than $922 billion higher than outpatient prescription drug spending.
- However, consumers’ out-of-pocket spending for hospital care ($32.5 billion) was nearly $14 billion lower than their out-of-pocket spending for outpatient prescriptions ($46.5 billion).
- In 2020, consumers’ out-of-pocket expenses—cash-pay prescriptions plus copayments and coinsurance—accounted for 13.3% of net drug spending. However, they were only on the hook for 2.6% of hospital spending.
[Click to Enlarge]
Per my commentary in Employer Pharmacy Benefits 2021: Patient Specialty Costs Rise with Coinsurance and Accumulators, some patients end up paying a much greater share of costs due to pharmacy benefit designs. This benefit design discrepancy goes a long way toward explaining why consumers are more critical of prescription drug spending than they are of hospital spending.
JUST THE FACTS
As my previous analyses have noted, hospitals and physicians often try to delegitimize the NHE as a measure of drug spending—so they can blame drugmakers for high healthcare spending.
Regular readers know the Drug Channels credo: "Everyone is entitled to their own opinion, but not their own facts." I will once again hope that these latest NHE facts help balance the public discussion of U.S. healthcare spending.
But will hope triumph over experience?
NOTES FOR NERDS
- U.S. drug spending in the NHE is roughly equivalent to total retail, mail, long-term care, and specialty pharmacies’ prescription revenues minus manufacturer rebates to third-party payers. It therefore differs from pharmacies’ prescription revenues, manufacturers’ revenues, and the “invoice price spending” data reported by IQVIA.
- We define “Professional Care” to include these NHE categories: Physician and Clinical Services; Dental Services; and Other Professional Services.
- The NHE’s outpatient drug spending do not measure total U.S. spending on prescription drugs. That’s because inpatient prescription drug spending within hospitals and spending on nearly all provider-administered outpatient drugs are reported within the hospital and professional services categories. CMS does not break out these figures, but Altarum estimates that provider-administered drugs account for additional drug expenditures of 4% to 5% of NHE. We note this additional spending in the first chart above.
- For 2019, the Centers for Medicare & Medicaid Services’ Office of the Actuary (OACT) implemented a comprehensive revision of the U.S. National Health Expenditure accounts. (I discussed these changes in my January 2021 NHE review.) The latest NHE data also contained some significant changes to the drug spending figures. For instance, the 2019 figure was revised downward by $31.5 billion (-9%). Most of these reductions came from private health insurance and consumers’ out-of-pocket spending. CMS did not respond to my request for an explanation of the 2020 restatements.
No comments:
Post a Comment