

When rebates and discounts were factored in, brand-name drug prices again declined—or grew slowly—in 2022. However, some companies had net price gains. Consistent with our previous analyses, rebates and discounts reduced the selling prices of brand-name drugs at the biggest drugmakers to less than half of their list prices.
For the eight companies with multiple years of data, the gross-to-net difference in price changes was the smallest gap in six years. See the second chart below.
As I have noted, powerful industry forces may trigger the gross-to-net bubble to deflate. But for now, the 2022 data provide fresh inconvenient facts for the drug pricing flat earthers (#DPFE).
Patient assistance funding accounts for a significant portion of gross-to-net differences. Learn about the future of these programs during my upcoming live video webinar, PBMs and the Battle Over Patient Support Funds: Accumulators, Maximizers, and Alternative Funding, on June 23, 2023, from 12:00 p.m. to 1:30 p.m. ET. Click here to learn more and sign up.
READ ME
If it’s your first time visiting Drug Channels, I suggest you review the following two recent articles:
- Four Trends That Will Pop the $250 Billion Gross-to-Net Bubble—and Transform PBMs, Market Access, and Benefit Design.This article includes frequently asked questions about gross and net drug prices, the gross-to-net bubble, and SpongeBob SquarePants.
- Brand-Name Drug Prices Fell for the Fifth Consecutive Year—And Plummeted After Adjusting for Inflation. This article reviews SSR Health’s product-level data on list and net prices.
You can also click here to read all Drug Channels’ articles on the gross-to-net bubble.
BUBBLETASTIC DATA
The following 10 companies publicly reported the 2022 list and net price changes for their U.S. product portfolios. Most also reported average discounts from list price. As always, I encourage you to review the original source material for yourself. Here are links to the relevant reports:
- Genentech did not update its Science of Pricing webpage with the 2022 data. However, Genentech privately provided the 2022 figures to me.
- Novo Nordisk: Annual Report 2022, page 89
- Teva: 2022 Environmental, Social and Governance Progress Report , page 29 (Note: Figures are for innovative branded medicines.)
There are two notable omissions from this year’s list:
- We again excluded Pfizer, because it reported the change in its average net price for 2022 (+6%), but did not report a corresponding figure for the change in list price. (See Pfizer: Environmental, Social & Governance Report 2022, page 54.)
- Unfortunately, Novartis chose not to report any “Affordability & Pricing” metrics for 2022. See Novartis in Society 2022 US Report, page 88
OUR BUBBLE BUDDY
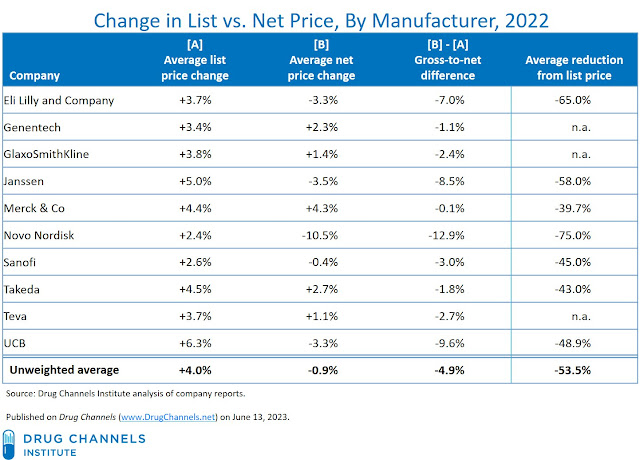
Gross-to-net gaps mean that brand-name manufacturers earn far less revenue than list prices suggest. The table below summarizes 2022's year-over-year changes in list and net price changes for the brand-name product portfolios of the 10 large manufacturers, along with average discounts.
[Click to Enlarge]

Consistent with our previous analyses, these data show significant gaps between list and net price changes:
- List prices for brand-name drug prices grew slowly. For 2022, brand-name drug list prices grew by 5% or less at 9 of the 10 companies. The unweighted average increase was 4.0%.
- Drugmakers sold their products for less than half of the list price. The unweighted average discount off list was 53.5%, i.e., less than half price. The weighted average brand-name portfolio had list-price discounts of -40% to -75%.
- Average discounts from list prices have been deepening for some (but not all) manufacturers. Five of the seven companies reporting average discounts from list prices showed deeper discounts in 2022 compared with 2021. For example, Janssen’s average discount rate went from -55% in 2021 to -58% in 2022, while Lilly’s rate went from -61% to -65%. However, two companies—Merck and Sanofi—saw a positive change in the average discount rate. In general, such disparities reflect differences between product portfolios.
- On average, net prices declined, though half of the manufacturers saw moderate net price growth. The unweighted change in net prices was --.9% in 2022. Net prices declined at five of the 10 manufacturers, but rose at five manufacturers—Genentech, GlaxoSmithKline, Merck, Takeda, and Teva.
- The unweighted average gross-to-net gap in prices was -4.9%. For 2022, list prices grew by 4.0%, but net prices declined by -0.9%. Gross-to-net differences ranged from -12.9% to -0.1%. The gross-to-net difference was negative for all 10 companies, indicating that net prices grew more slowly than list prices for all manufacturers.
BUBBLICIOUS
The chart below summarizes price changes from 2017 through 2022, for the eight companies that consistently provided these data over the past six years.
[Click to Enlarge]

Observations:
- List-price growth has remained moderate. In recent years, unweighted average list prices have grown at mid-single-digit rates. Since 2020, average list price growth has increased slightly, from 2.8% in 2021 to 4.0% in 2022. Those growth rates were much lower than overall inflation.
Note that these averages were consistent with the overall industry time trends shown in Brand-Name Drug Prices Fell for the Fifth Consecutive Year—And Plummeted After Adjusting for Inflation. (The industry data are based on approximately 1,000 brand-name drugs with disclosed U.S. product-level sales from approximately 100 currently or previously publicly traded firms.)
- Average net prices at the large drugmakers have declined for the past six years. The time series data clearly contradict the overheated and misleading rhetoric from DPFEs.
- The gross-to-net bubble keeps inflating. We estimate that in 2022, the total value of gross-to-net reductions for patent-protected brand-name drugs was $223 billion, up by about $70 billion (+45%) compared with the 2017 figure. The list and net price changes shown above sustain ever-increasing rebate dollars.
- The average gap between changes in list and net prices has narrowed. For 2018, the average gap was -8.0% [+5.5% vs. -2.5%]. But for 2022, the gap has shrunk to -5.5% [+4.0% vs. -1.5%]. As we note above, this shrinkage reflects multiple company-specific factors related to product portfolios, payer mix, patient assistance program management, channel strategies, and more.
POPPING BUBBLES?
The gross-to-net bubble’s significant impact on patients—especially when patients are exposed to the undiscounted list price of their prescriptions—remains.
Consider Lilly’s disclosure that from 2016 to 2022, the list price of its brand-name Humalog insulin grew by only $7 (+3%), while its net prices declined by $21 (-34%). Consequently, each vial had a net price of $40, but generated $235 in rebates and discounts. (Are you listening, Senator Sanders?)
In a previous article, I described four crucial trends that will deflate the gross-to-net bubble. By altering plans' desire for high-list / high-rebate products and disincentivizing list price increases, the Inflation Reduction Act of 2022 will start to shrink the dollar value of differences between manufacturers’ gross and net sales. The government’s rushed implementation of the IRA creates further risks for unanticipated distortions in the U.S. pharmaceutical ecosystem.
While gross-to-net differences have narrowed, I expect these gaps to eventually be unsustainable. The Humira price war signals change is coming to some of the biggest products on the market. Our friend Mr. SquarePants can look forward to popping more bubbles.
No comments:
Post a Comment