

The retail pharmacy shakeout affected 2021 pharmacist employment. We found that retail pharmacies and drugstores employed fewer pharmacists, while hospitals and outpatient centers continued to add positions. As a result, the share of pharmacists who work in non-retail practice settings reached a new high.
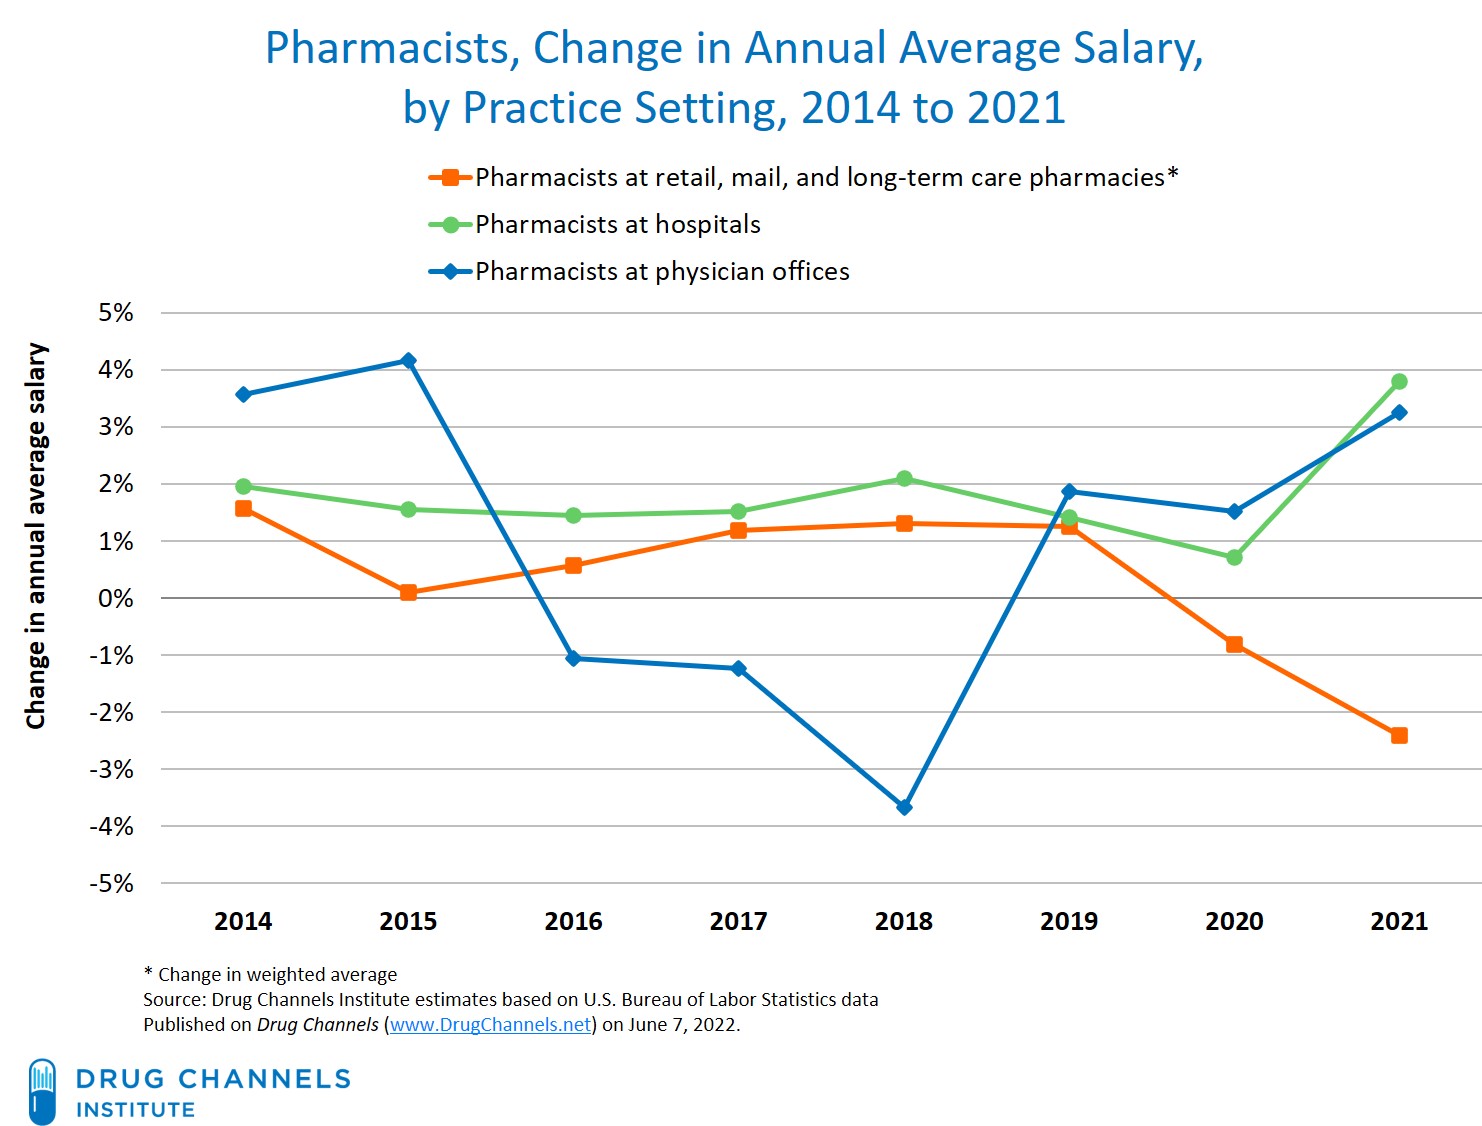
What’s more, average base salaries for retail pharmacists dropped for the second year, while salaries continued to rise for pharmacists employed by hospitals, physician offices, and other non-retail settings. Full salary data below for your enjoyment or sorrow.
As expected, the past few years have been highly challenging for retail-employed pharmacists. Expect further declines as the shakeout continues.
TREND TRACKING
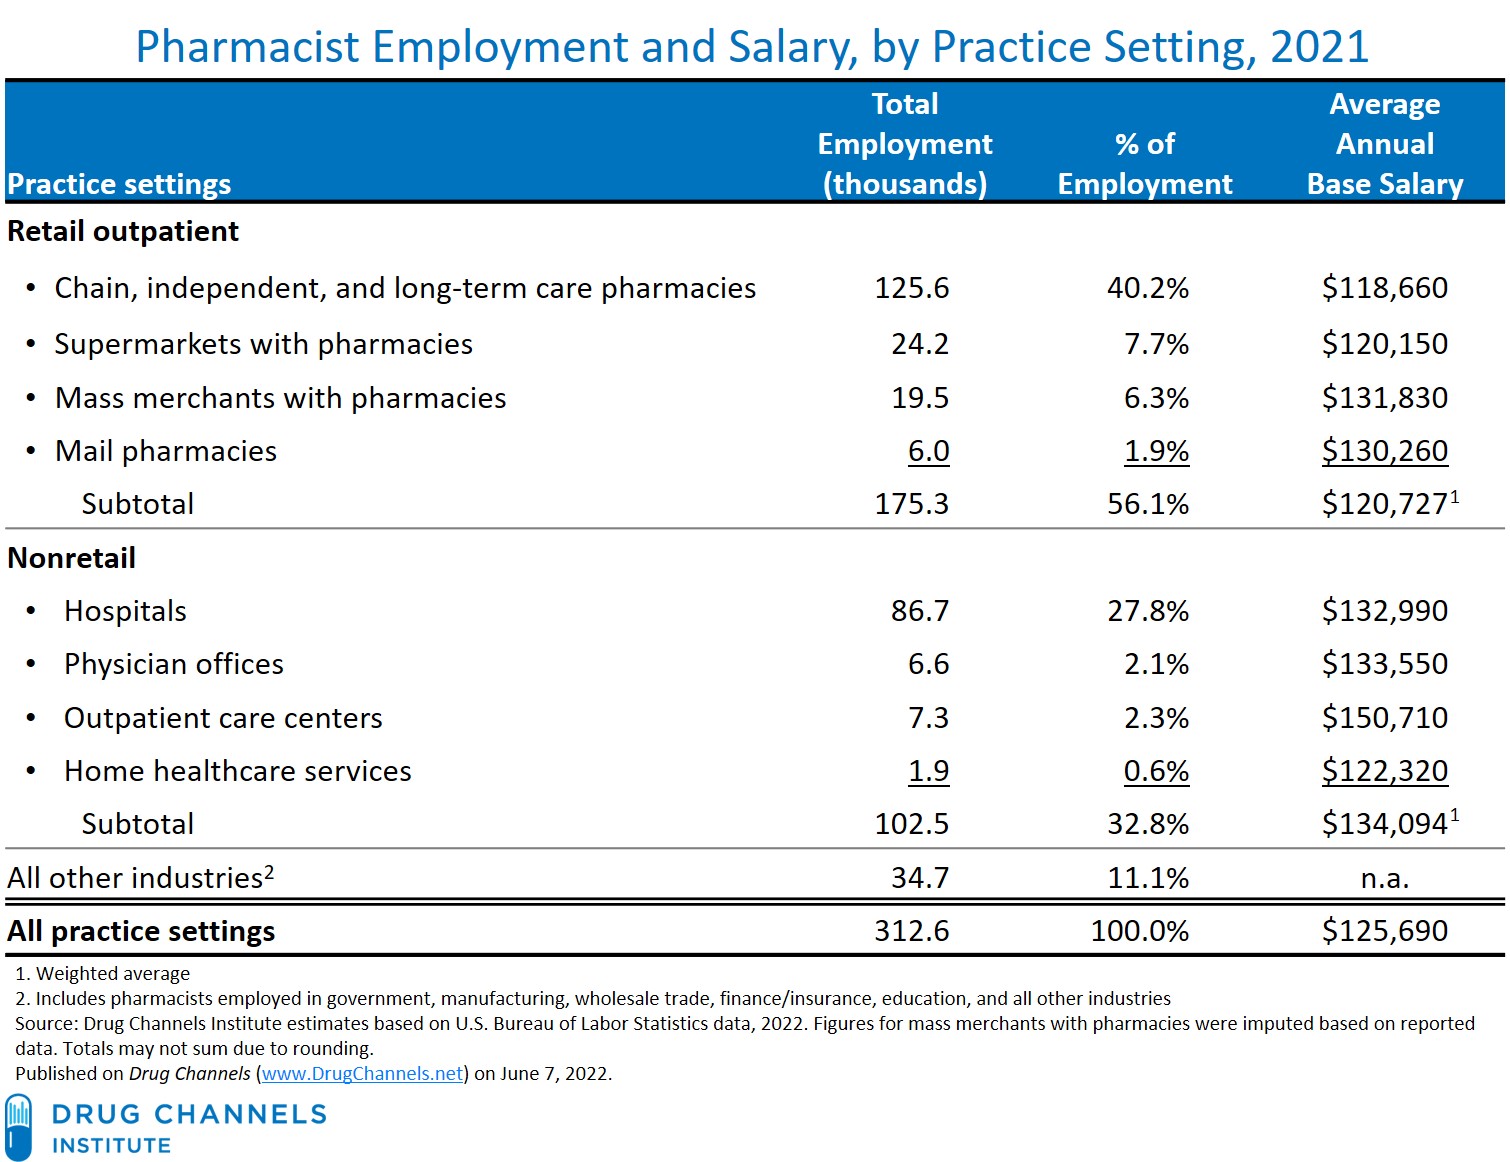
The table below profiles overall employment and salaries for U.S. pharmacists in 2021. We rely on data from the U.S. Bureau of Labor Statistics (BLS). Details on the data and our methodology appear at the bottom of this article.
[Click to Enlarge]
Our observations about the recent employment trends:
- Overall retail pharmacist employment dropped in 2021. Last year, there were 175,320 pharmacists employed at retail outpatient settings: chain drugstores, independent pharmacies, supermarkets, mass merchants, and mail pharmacies.
Total employment in these settings has declined significantly from its recent peak of about 189,000 people in 2017—and declined by 7,000 in 2021. However, the 2021 net change reflected a shift in the composition of retail employment. Compared with 2020, employment at retail pharmacies and drugstores declined by 9,300 positions, while employment at other retail settings grew by 2,300 positions.
- Hospitals and physician offices continue to grow as a source of pharmacist employment. Total U.S. pharmacist employment has grown, from more than 286,000 in 2013 to more than 312,000 in 2021. The share of pharmacists employed in non-retail settings—hospitals, physician offices, outpatient care centers, and home health—grew significantly during this period, from 27% in 2013 to 33% in 2021. Consequently, pharmacist employment at non-retail settings grew by nearly 25,000 from 2013 to 2021.
Note that the non-retail figure likely understates pharmacist employment by hospitals. That’s because hospital-owned retail pharmacies are included within the retail category. (See our Notes for Nerds, below.)
Observations about the recent salary trends:
- The average pharmacist’s salary was unchanged for 2021. Despite the ongoing pandemic, overall average salaries across all industry settings were $125,690—roughly equal to the 2020 figure of $125,460. However, pharmacists who work in hospitals had higher pay (+3.8%; green line in chart below), while those in retail outpatient dispensing formats experienced a second year of lower pay (-0.8% in 2020 and -2.4% in 2021; orange line).
[Click to Enlarge]

- The salary gap between a pharmacy owner and an employed retail pharmacist has grown for the third year. Our analysis of industry survey data indicates that the average pharmacist owning a single pharmacy earned about $158,000 in 2020 (the most recent year for which data are available). Independent pharmacy owner profits improved in 2020 due largely to better expense control, not higher prescription volume. See Five Things to Know About the State of Independent Pharmacy Economics.
By contrast, U.S. government data show that the average gross base salary for a pharmacist working in a chain, independent, or long-term care setting was about $122,000 for 2020. Owning a pharmacy, with all of its hassles and obligations, remains more remunerative than being an employee. (Note that the table above includes pharmacists employed by an independent pharmacy as well as the paid owners and officers of incorporated independent pharmacies.)
We rely on the 2021 Occupational Employment and Wage Statistics (OEWS) program (formerly known as the Occupational Employment Statistics program) from the Bureau of Labor Statistics (BLS). BLS and the State Workforce Agencies (SWAs) collaborate on the OEWS survey. BLS funds the survey and dictates its structure, while the SWAs collect most of the data. The OEWS survey categorizes workers by detailed occupations based on the Standard Occupational Classification (SOC) system. For more on these data, see the OEWS FAQ page.
The Pharmacist occupation code is 29-1051. The SOC defines pharmacists’ roles as follows:
“Dispense drugs prescribed by physicians and other health practitioners and provide information to patients about medications and their use. May advise physicians and other health practitioners on the selection, dosage, interactions, and side effects of medications.”Using these data, we identified pharmacists working in various retail and non-retail settings based on the NAICS (North American Industry Classification System).
A few more items of note:
- BLS computes the annual wage data by multiplying an hourly mean wage by a "year-round, full-time" figure of 2,080 hours. These data exclude bonuses and employer costs of nonwage benefits, such as health insurance and contributions to retirement plans.
- Pharmacists employed by an independent pharmacy are included, as are paid owners and officers of incorporated independent pharmacies. However, the data exclude business owners and partners in unincorporated pharmacies.
- The data show the location of employment as a "pharmacist." They do not specify the duties that the pharmacists perform or the entity that operates the pharmacy.
- The NAICS industry code “446110 Pharmacies and Drug Stores” includes drug stores, pharmacies, and on-site institutional pharmacies. Thus, a pharmacist employed in a hospital’s retail outpatient pharmacy is likely classified as an employee of a retail pharmacy.
- The NAICS industry code “446110 Pharmacies and Drug Stores” includes drug stores, pharmacies, and on-site institutional pharmacies. Thus, a pharmacist employed in a hospital’s retail outpatient pharmacy is likely classified as an employee of a retail pharmacy.
- With the 2021 figures, the OEWS program began using a new estimation methodology. Hardcore nerds can peruse the technical details in Survey Methods and Reliability Statement for the MB3 Research Estimates of OEWS. The 2020 figures do not appear to be materially different from the figures that I reported in last year’s analysis, but I still recommend caution in evaluating the year-over-year changes.
No comments:
Post a Comment